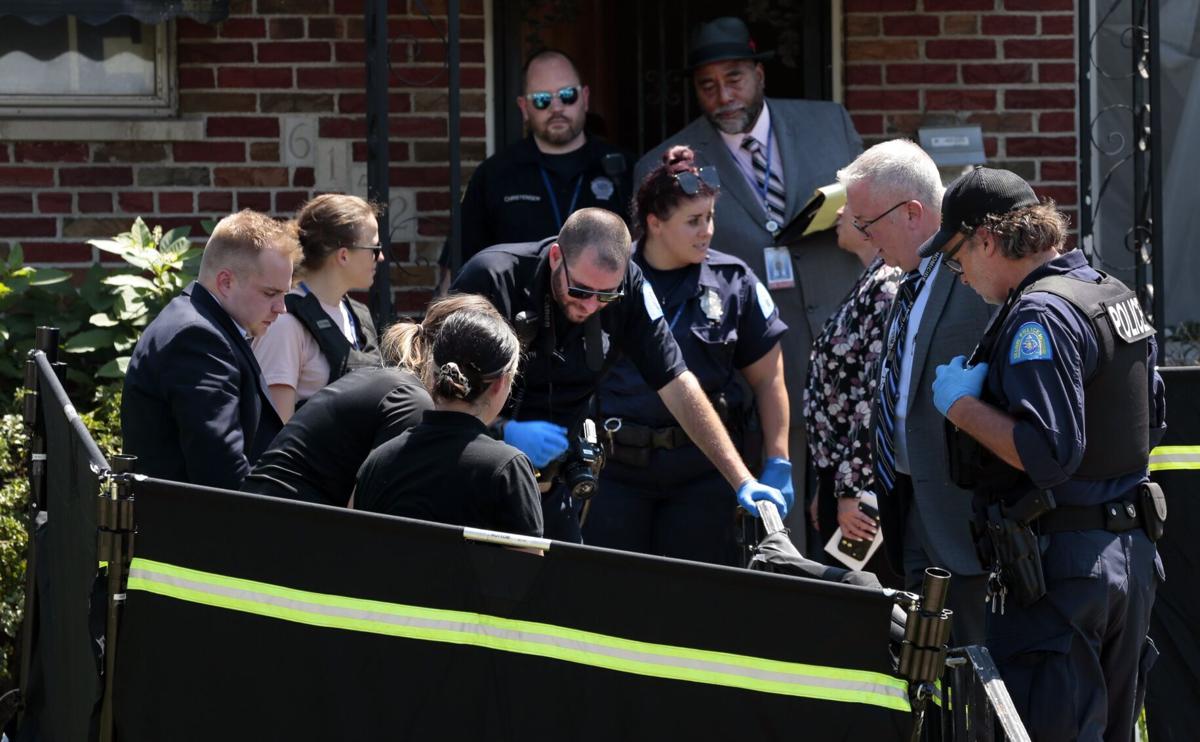
ST. LOUIS ŌĆö For the first time this year, the city is on pace to log more homicides than it did last year, after a spate of killings this week sent homicide totals soaring.
Nine deaths this week pushed city homicides to 125 as of Friday afternoon, police said. There were 118 at the same time last year.
The grim statistics suggest one of the more encouraging trends in the city could reverse itself at the same time business leaders are asking the city to do more to stem drag racing and late-night mayhem downtown, and homelessness, fighting and aggressive panhandling on South Grand Boulevard. The issues compound problems the city has picking up trash, answering 911 calls and getting ambulances to emergencies.
A spokesman for the cityŌĆÖs Department of Public Safety said in a statement that officials meet weekly to discuss strategies to tackle crime, and are partnering with federal agencies to fight violence together. ŌĆ£The recent incidents are concerning and affect us all,ŌĆØ the spokesman, Monte Chambers, said.
People are also reading…
After recording 263 homicides in 2020 ŌĆö and setting a record high rate ŌĆö the city saw the number slide by a quarter in 2021 even as violent crime consumed many other U.S. cities.
Mayor Tishaura O. Jones and her public safety chief told national publications that the decline was evidence their new approach to violent crime was paying early dividends. Focusing on reducing poverty, giving young people more things to do and focusing police attention on the worst offenders was paying off, Jones told The Washington Post.
The first seven months of the year offered more reason to believe: The city entered August with eight fewer homicides than it did last year. But the addition of more than 20 killings so far this month has turned that on its head. And this week has been especially deadly.
On Monday afternoon, police responded to a call about a man in his 40s shot in the head in the Hamilton Heights neighborhood, on the cityŌĆÖs northwest side. A few hours later, they found a 31-year-old man shot and lying in the street in Mount Pleasant, in the southeast part of the city.
Two days later, officers found two men fatally shot in The Ville neighborhood, an 18-year-old shot and killed in Hamilton Heights, and a 63-year-old woman dead in Jeff-Vander-Lou, all on the cityŌĆÖs north side.
And on Thursday, police found a man shot to death in an alley in Mount Pleasant and two men killed in Gravois Park, on the cityŌĆÖs south side.
Chambers, the public safety spokesman, asked residents to call police with information that could help investigations.
ŌĆ£We value the lives of all citizens and visitors in our city,ŌĆØ he said.
HOMICIDES IN ST. LOUIS, 1970-2024
We calculated the homicide rate based on the total number of homicides reported by the 51║┌┴Ž Metropolitan Police Department, our archives, and the latest U.S. Census population estimates.╠²╠²
The total number of homicides in 51║┌┴Ž hit a historic high of 267 in 1993. But the population of the city then was much higher than it is today, and the homicide rate was 69 per 100,000 people.
The total number of homicides hit 263 in the pandemic year of 2020, giving a city with a much smaller population╠²its highest-ever rate, 87.6 per 100,000 people.╠²
This table was revised on March 12, 2025, to reflect the latest population estimates for the city for the years 2020 through 2024.╠²
Sources: 51║┌┴Ž archives;╠²51║┌┴Ž Metropolitan Police Department; U.S. Census.
╠²
| ’╗┐YĘĪ┤ĪĖķ | POPULATION | HOMICIDES | RATE PER 100K |
|---|---|---|---|
| 1970 | 622,236 | 266 | 42.7 |
| 1971 | 602,600 | 220 | 36.5 |
| 1972 | 579,600 | 205 | 35.4 |
| 1973 | 539,300 | 215 | 39.9 |
| 1974 | 530,800 | 202 | 38.1 |
| 1975 | 514,000 | 241 | 46.9 |
| 1976 | 505,300 | 224 | 44.3 |
| 1977 | 486,800 | 195 | 40.1 |
| 1978 | 470,900 | 211 | 44.8 |
| 1979 | 457,500 | 265 | 57.9 |
| 1980 | 450,790 | 225 | 49.9 |
| 1981 | 454,166 | 264 | 58.1 |
| 1982 | 455,362 | 226 | 49.6 |
| 1983 | 457,262 | 152 | 33.2 |
| 1984 | 442,528 | 128 | 28.9 |
| 1985 | 431,109 | 169 | 39.2 |
| 1986 | 434,298 | 195 | 44.9 |
| 1987 | 429,414 | 153 | 35.6 |
| 1988 | 425,187 | 140 | 32.9 |
| 1989 | 405,066 | 158 | 39.0 |
| 1990 | 396,685 | 177 | 44.6 |
| 1991 | 399,858 | 260 | 65.0 |
| 1992 | 402,573 | 231 | 57.4 |
| 1993 | 387,053 | 267 | 69.0 |
| 1994 | 390,437 | 248 | 63.5 |
| 1995 | 371,425 | 204 | 54.9 |
| 1996 | 374,041 | 166 | 44.4 |
| 1997 | 377,221 | 153 | 40.6 |
| 1998 | 344,153 | 113 | 32.8 |
| 1999 | 340,836 | 130 | 38.1 |
| 2000 | 348,189 | 123 | 35.3 |
| 2001 | 350,336 | 148 | 42.2 |
| 2002 | 353,004 | 113 | 32.0 |
| 2003 | 340,256 | 74 | 21.7 |
| 2004 | 335,143 | 114 | 34.0 |
| 2005 | 346,005 | 131 | 37.9 |
| 2006 | 346,879 | 129 | 37.2 |
| 2007 | 348,197 | 138 | 39.6 |
| 2008 | 356,204 | 167 | 46.9 |
| 2009 | 355,208 | 143 | 40.3 |
| 2010 | 355,151 | 144 | 40.5 |
| 2011 | 320,454 | 113 | 35.3 |
| 2012 | 318,667 | 113 | 35.5 |
| 2013 | 318,416 | 120 | 37.7 |
| 2014 | 318,574 | 159 | 49.9 |
| 2015 | 317,095 | 188 | 59.3 |
| 2016 | 314,507 | 188 | 59.8 |
| 2017 | 308,636 | 205 | 66.4 |
| 2018 | 302,838 | 186 | 61.4 |
| 2019 | 300,576 | 194 | 64.5 |
| 2020 | 300,315 | 263 | 87.6 |
| 2021 | 293,484 | 202 | 68.8 |
| 2022 | 286,292 | 201 | 70.2 |
| 2023 | 282,772 | 160 | 56.6 |
| 2024 | 279,695 | 150 | 53.6 |


